
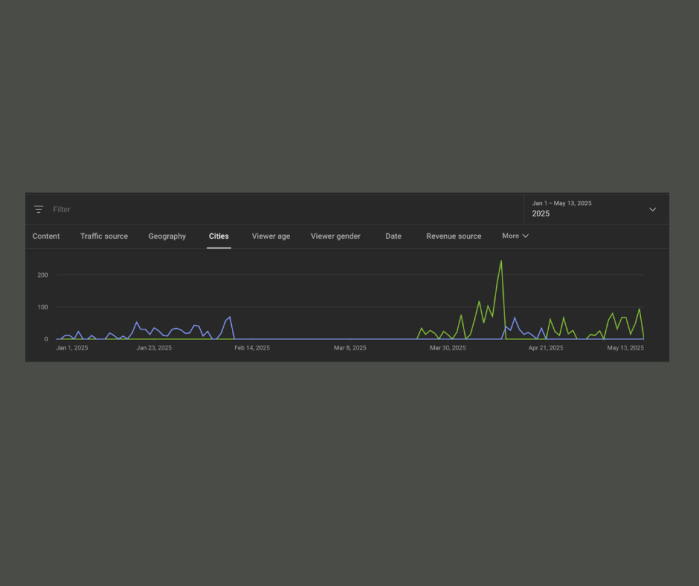
Nerd talk time! Analytics definitely tell stories. Here’s a 2025 YouTube graph of 2 neighbouring cities (in my geographical location) and their behaviours/patterns. There are a few things to observe here. Note the flat area in the middle and how it picks up. That flat area was when I had traveled away from home (my geographical content changed) and those locations, did not tune in until after I returned. Also note how they alternate so when one is active the other isn’t. Might this be the same person in 2 locations traveling back and forth? Why did they stop observing my content when I left my geographical location? Are they only interested when I am producing content from my home? Do they have a specific interested in the local nature content? Might it be to monitor my behaviour locally? There are other possibilities to consider as well. Also, when I follow the locations back in the data, I can see one (blue) entered my YouTube channel a couple of years ago while the other (green) this spring. No matter if it’s 1, 2 or more people, they are contributing to my watch time. Analyzing behaviours is helpful in determining the channels activity and changes. In this case, I see what they were doing and on what days. See that green peak on the graph below? That was April 11 and below that is a screen-grab of what I uploaded on that day (local nature shorts):


I should mention that I do not indicate my location nor in my hashtags. One doesn’t need to be subscribed to a YouTube channel for the statistics to pick up their behaviours.
📈📉 I studied analytics with my Google certification and while I really didn’t love the topic, it’s definitely coming in handy now. This might be a teaching moment and hope it helps someone else read their statistics and contemplate the stories they tell!